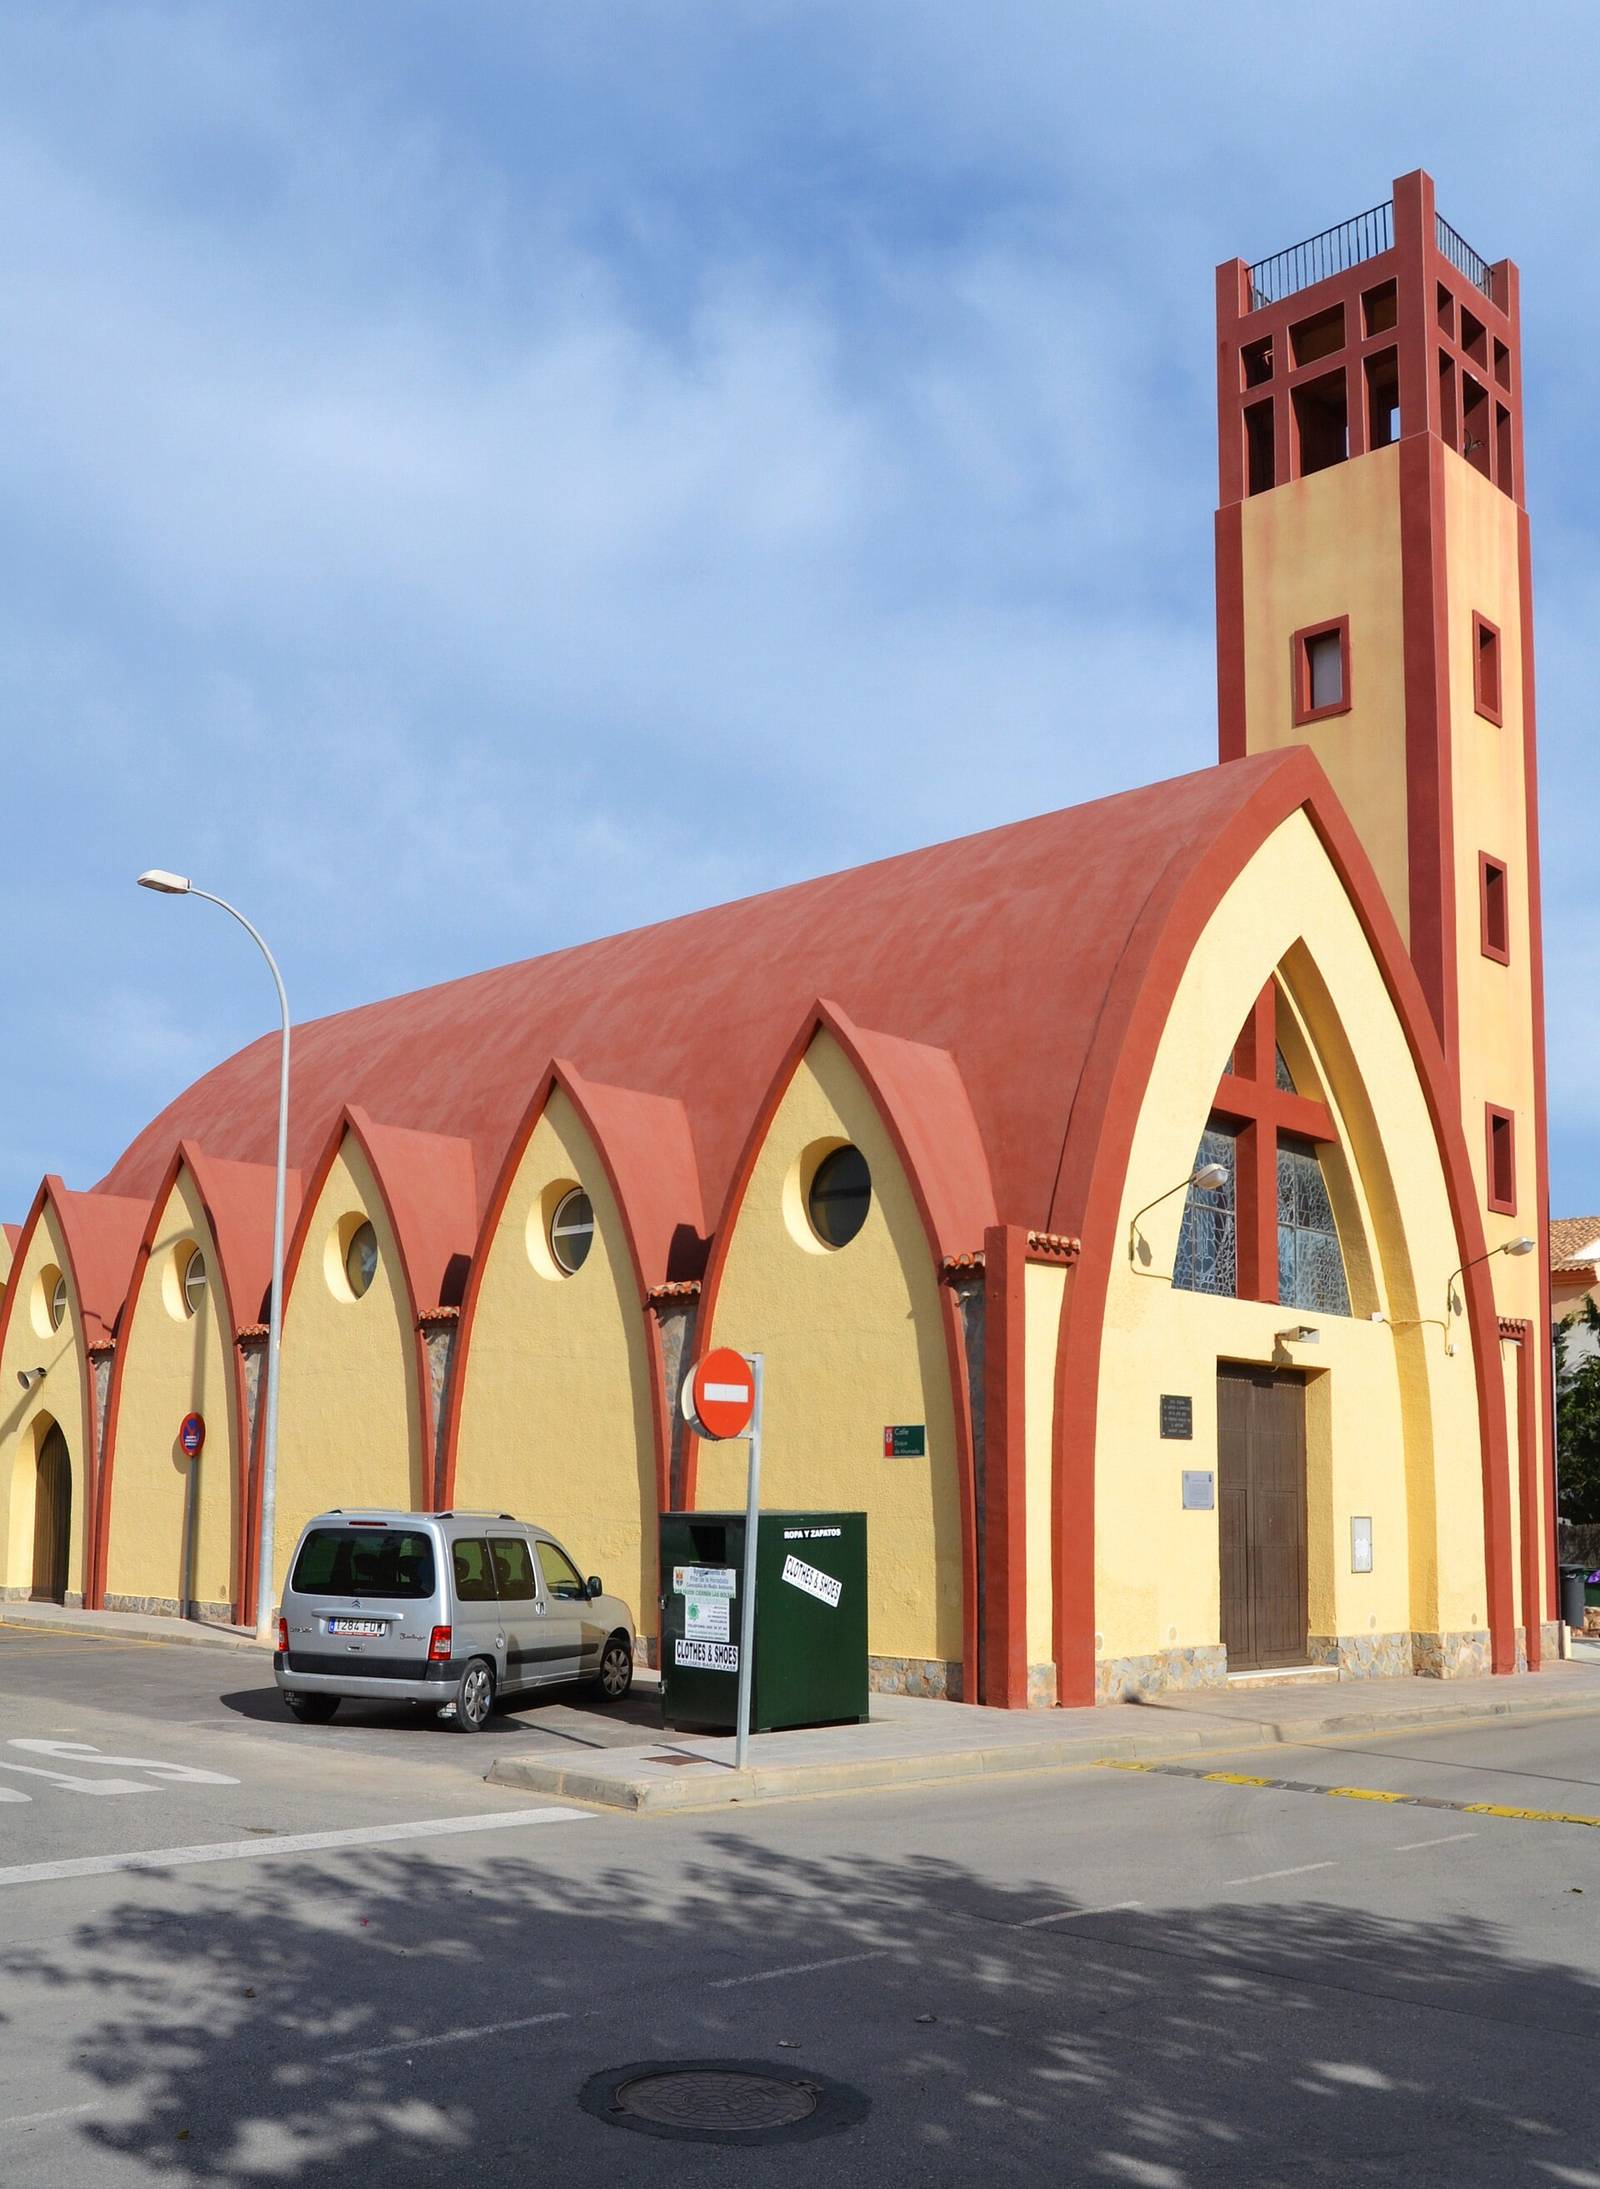

Pilar de la Horadada
Alicante/Alacant · the Valencia region
Pilar de la Horadada is a municipality of 24,359 residents in Alicante province, the Valencia region, about 5 km from the nearest coastline. Registered long-let rents average €5.34/m² a month — roughly 4% below the national municipal average of €5.57. Among residents, about 12% hold UK nationality.
“The town and its neighbouring villages (Pinar de Campoverde and Torre de la Horadada) are home to thousands of British, German and northern European expatriates.”
The case for Pilar de la Horadada
- 8.1 hours of sunshine a day, averaged across the year
- only 30 rainy days a year
- 12.5°C average winters
- registered long-let rents of €5.34/m² a month
- RMU airport 42 minutes away
- Torrevieja — a 100,000+ city — 34 minutes by road
- AVE high-speed rail about 23 minutes away
- 49 restaurants and cafés
- 9 schools in town
No adjectives, no opinions — every line is a measured value from the data below, shown only when Pilar de la Horadada genuinely earns it. Distances marked "as the crow flies" are straight-line estimates.
Pilar de la Horadada's Spainability Scores
Percentile within each canonical persona's scoreable municipality pool.
Higher than 79% of 2,555 scoreable municipalities.
Higher than 99% of 8,088 scoreable municipalities.
Higher than 98% of 8,088 scoreable municipalities.
Higher than 99% of 2,299 scoreable municipalities.
Higher than 99% of 2,299 scoreable municipalities.
Higher than 98% of 2,299 scoreable municipalities.
Published data for Pilar de la Horadada
Climate
- Winter average temp
- 12.5°C top 7% of 8,131 towns 4.7°C above the Spanish average (7.8°C)
- Summer high (Jul–Aug)
- 29.5°C top 35% of 8,131 towns 0.7°C below the Spanish average (30.2°C)
- Rainy days a year
- 30 days top 1% of 8,088 towns 56% less than the Spanish average (69 days)
- Sunshine
- 8.1 h/day top 14% of 3,829 towns 11% more than the Spanish average (7.2 h/day)
- Summer water stress (WEI+) regional estimate
- 259 bottom 1% of 8,033 towns 203 above the Spanish average (56)
- River-flood depth (T=100, town centre) estimated
- 0 m top 1% of 8,129 towns 0.04 m below the Spanish average (0.04 m)
- River-flood risk score estimated
- 0 top 1% of 8,129 towns about the Spanish average (0)
- Wildfire burn rate (2010–23)
- 0.03 ha/km² top 43% of 8,132 towns 2.28 ha/km² below the Spanish average (2.31 ha/km²)
- Forest fires (2010–23)
- 1 top 39% of 8,132 towns 5 below the Spanish average (6)
- High fire-weather days (province) regional estimate
- 25.1% bottom 24% of 8,130 towns 2.2% above the Spanish average (22.9%)
Cost & economy
- Home price
- no local data
- Asking price
- no local data
- Registered long-let rent
- €5.34/m²·mo
- Registered rent p25
- €3.92/m²·mo
- Registered rent p75
- €6.67/m²·mo
- Registered-rent yield
- no reliable sale-price data — yield not imputed
- Net income per person
- €11,455 bottom 12% of 8,059 towns 21% less than the Spanish average (€14,495)
- Income growth ’18–’23
- 32.7% top 16% of 6,605 towns
Schools
- Schools in town
- 9 top 7% of 7,042 towns
- Nearest international school
- 7 km top 5% of 8,132 towns
- PISA maths (region) regional estimate
- 473 #10 of 17 regions, −6 vs national 8 below the Spanish average (481)
Healthcare
- Drive to a hospital
- 15 min top 13% of 8,132 towns
- Nearest health centre
- 7.9 km top 46% of 8,132 towns
- Surgical wait (region) regional estimate
- 88 days #6 of 17 regions, −15 days vs national 18% less than the Spanish average (108 days)
Getting around
- Drive to nearest airport
- 42 min top 17% of 8,132 towns
- Fibre-to-home coverage
- 99% top 9% of 8,132 towns 20% above the Spanish average (79%)
- 100 Mbps+ coverage
- 100% top 1% of 8,132 towns 17% above the Spanish average (83%)
Who lives here
- Population
- 24,359
- Born in Spain
- 56.6% 32.2% below the Spanish average (88.8%)
- Born elsewhere in EU/UK
- 23.4% 19.6% above the Spanish average (3.8%)
- U.S.-born residents
- 1.4 per 1,000
Monthly climate normals
Numbers: Spainability town dataset. Missing fields are shown as missing. Registered rent, sale appraisal and asking-price figures keep their separate basis labels.
Questions to verify locally
- Ask whether current long-let rents match the registered-contract figure.
- Request comparable sales; neither appraisal nor asking data is published.
- Test fibre speed at the exact address, not the town average.
- Visit local schools and confirm places for incoming families.
- Confirm health-centre registration and opening hours in person.
- Ask an insurer how the mapped flood or wildfire exposure affects cover.
Nearby towns
Other places we cover within easy reach.